CH 01Technical Teardown · 09 August 2026 · 6 min
Web Ocean 3D: what broke when other people ran it
Sharing my browser ocean exposed a texture budget I was not measuring. The repair cut asset allocation, increased download weight, and revealed a broken visual baseline.
The ocean demo worked on the machine that built it. The useful engineering started when it failed on other machines.
I had built an interactive ocean with spectral waves, weather, underwater views and a boat responding to the water. Much of the early work was about what the scene looked like. Sharing it changed the question: could the browser finish loading everything and keep the scene alive?
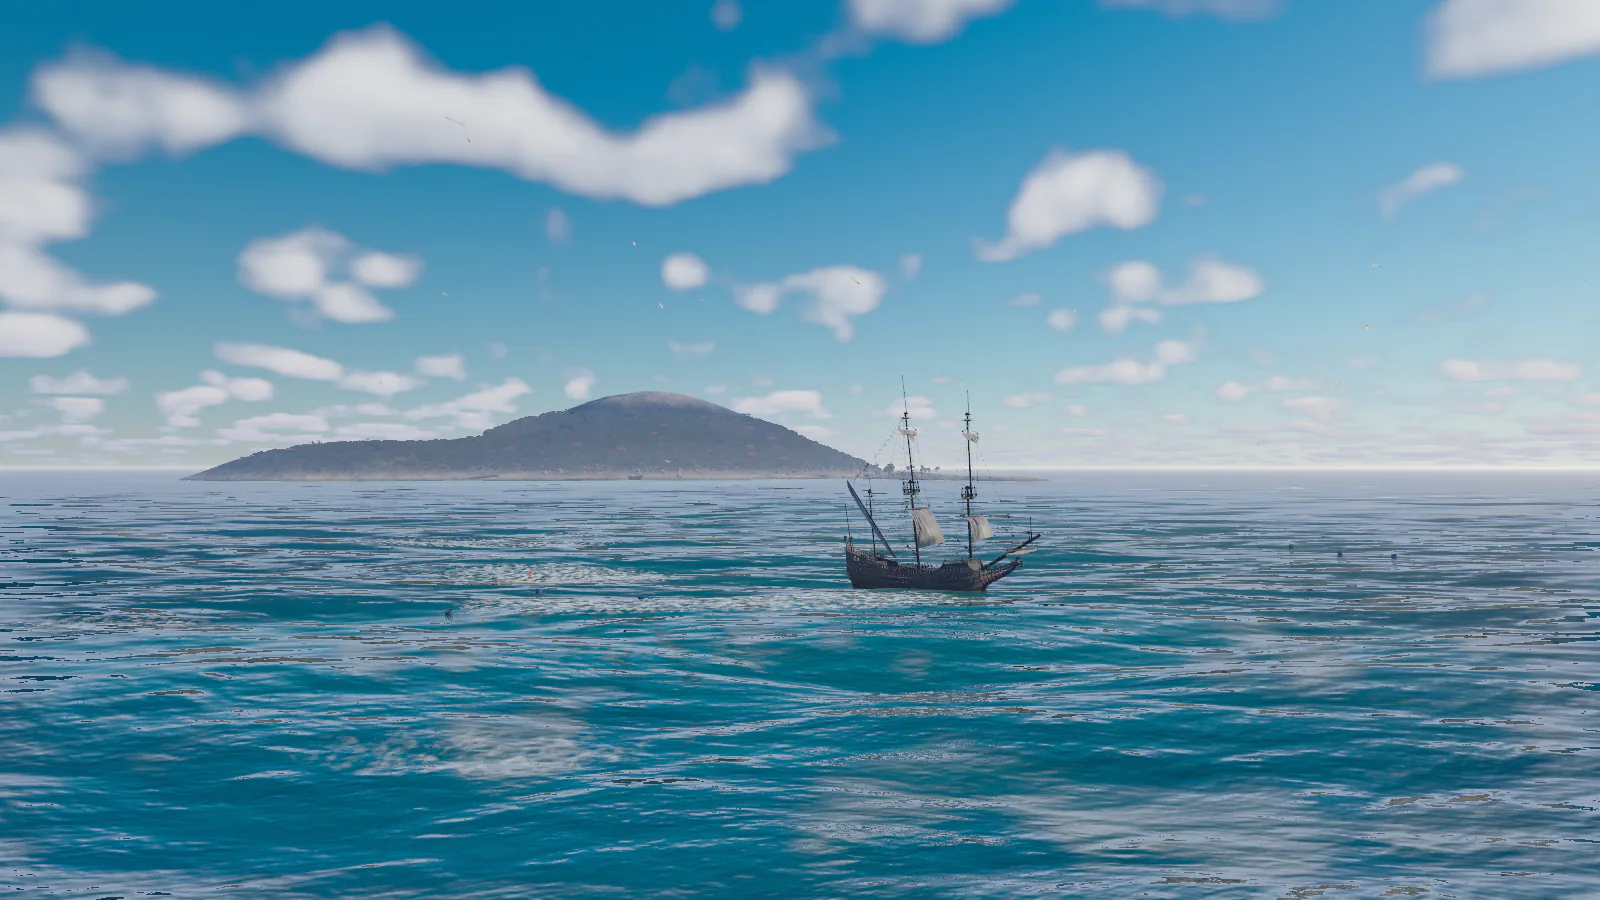
Some visitors crashed the tab. Those reports were useful, but they were not a controlled device study. I do not have a complete record of each visitor’s browser, GPU, available memory and settings. I cannot honestly reconstruct a low-end device matrix from the comments. What I can explain is the resource problem the investigation exposed, the changes recorded in the repository, and the limits of the measurements.
The budget I was not watching
The water’s render targets were an obvious place to look. Reflections, wakes and other passes allocate resources whose cost changes with quality settings. But the island’s dressing assets were expensive before the renderer even reached those effects.
The GLB asset set carried uncompressed textures and repeated maps across levels of detail. A lower-detail model does not save texture memory if it brings another copy of the same texture. A cache keyed by URL cannot know that two different asset URLs contain duplicate pixels.
The completed low-end pass records the following comparison. It is a dressing-texture budget, not total GPU memory, total process memory or a browser VRAM measurement. The values are from the repository’s performance record, not a new benchmark run for this article.
| Same dressing asset set | Before | After |
|---|---|---|
| Recorded texture allocation | 762.3 MiB | 79.9 MiB |
| Download weight | 33.7 MiB | 40.7 MiB |
Texture allocation
Scale: 0–800 MiB
Before762.3 MiB
After79.9 MiB
Download weight
Scale: 0–50 MiB
Before33.7 MiB
After40.7 MiB
The download got larger while the texture allocation got smaller. That is not a contradiction. Transfer size and the GPU representation are different budgets, and the codec choices traded one for the other. Compressed allocation also depends on the target format the device supports. This table is not a promise that every GPU will allocate precisely the same number of bytes.
I do not have a matched before-and-after load-time, presented-frame-rate or boot-pipeline-count measurement for this pass. Those cells should remain missing, not be filled with a number from a different revision or an estimate in a design document.
What changed in the asset path
KTX2 became part of the asset pipeline and loader. The compressor used different choices for different texture jobs: ETC1S for colour and ARM maps, UASTC for normals and alpha-cutout leaf atlases, with rate-distortion optimisation and lower-resolution normals. Keeping the alpha edges useful mattered for foliage. Making every map as small as possible was not the sole objective.
The runtime loader detects compressed-texture support before loading those assets. Its six-slot queue bounds simultaneous work, and timeouts and abort handling give stalled requests a failure path. None of those mechanisms makes an individual asset free. Together they make resource use and failure less accidental. The implementation is in AssetLoader.
There is a related rendering trade-off in the island itself. The canopy and impostor work reduce how much distant dressing needs to be represented as full geometry. Lighting has to remain coherent as that representation changes. A cheaper silhouette needs comparison against the scene the representation is meant to stand in for.
Compression introduced a different defect
The first compressed version passed its visual tests and still looked wrong.
Codec perceptual tuning and a texture’s transfer-function metadata are different settings. Some data maps had been tagged as sRGB, so the renderer treated numeric material data as colour. The result changed how surfaces responded to light. The pale, over-glossy hull was a rendering defect, not an artistic improvement.
The uncomfortable part was the test result. New screenshots had been accepted as the new baseline, and comparing a broken render with another copy of itself could not expose the regression. I needed the earlier known-good appearance, as well as a check on the asset metadata.
The repository now contains a direct gate for the latter:
node scripts/fix-ktx2-transfer.mjs --checkThat command checks transfer-function metadata. It does not judge the image. I want both checks because they answer different questions: is the asset labelled correctly, and did the change preserve the intended appearance?
Resource lifetime is part of the scene
A quality switch can briefly be the most expensive moment if old and new resources coexist. Tier-dependent targets therefore need deliberate disposal and reallocation, not just a new preset value.
The ocean’s material is an exception to that rule. Rebuilding it on every tier change had leaked node-graph textures and could lose an existing depth connection. The later implementation retains the material and changes its cascade bindings in place. I need to know which resources change ownership, which change size and which should survive a downgrade.
Low settings also reduce target budgets and cap DPR before framebuffer allocation. The WebGL2 path provides another compatibility route. Neither fallback should be described as proof that every low-end device now works.
Read the benchmark with its date attached
There is a checked-in reference run. It predates the low-end asset pass, which is why I am not combining its frame timings with the later texture numbers into a before-and-after performance claim.
| Reference-run condition | Recorded value or scope |
|---|---|
| Date | 2 August 2026 |
| Host | Windows 11, Ryzen 7 9800X3D |
| Browser-selected GPU | NVIDIA GeForce RTX 5090 |
| Browser | Headed Chrome 150.0.7871.187 |
| Viewport | 1600 × 900, DPR 1 |
| Scene | Fixed above-water camera and preset |
| Timing | GPU timestamps, with vsync and timestamp quantisation disabled by flags |
The harness distinguishes GPU frame time from the rate at which the browser delivers animation callbacks. Callback rate is not a count of frames presented on the screen. It also refuses to treat a hidden window, unavailable timestamps or a headless diagnostic run as a valid performance pass.
On a checkout with the documented dependencies, the reproducible entry point is:
npm run benchThis builds the scene and runs the headed benchmark harness. I have not rerun it for this article. A meaningful follow-up would use the same revisions, camera, preset, resolution and measurement method on both sides of a change, then add lower-capacity hardware and expensive scene states.
What I would check before sharing the next scene
- Keep download weight, decoded asset allocation and render-target budgets separate.
- Record the adapter the browser actually selected, not only the GPU fitted to the machine.
- Inspect material metadata after conversion, especially non-colour maps and alpha edges.
- Compare against a trusted visual baseline before accepting a replacement.
- Exercise quality changes repeatedly and inspect resource lifetime, not just the final steady state.
- Test interrupted loading, missing assets and unsupported graphics paths.
- Publish tail frame times and demanding camera states alongside a median from an easy view.
The remaining work is specific: genuine memory-pressure tests, a matched post-pass frame-time matrix, and more hardware. The asset record shows the resource repair, not universal stability.
A realtime demo is not finished when it looks right on the author’s GPU. It is finished when its resource budget and failure path are explicit.
End of transmission
Reply on the same line: dial in below.